Institutional Rigor.
Zero Compromise.
The regime-adaptive capital preservation engine that answers the most critical question in finance with math, not opinions: Is it safe to invest today?
Built for Portfolio Managers, CIOs, RIAs, and hedge funds. Oneiros Vision synthesizes raw macroeconomic telemetry into a single, actionable Master Danger Index — replacing static 60/40 assumptions with dynamic, rules-based risk governance.
Empirical proof of capital preservation.
Backtested over a 16-year period (Jan 2010 – Aug 2026) with T+1 execution — every signal traded at the close of the following session — and institutional-grade round-trip transaction costs (2 bps per leg). Against a standard 60/40 mandate, the Apex implementation generates +3.9pp of annualized return while reducing maximum drawdown by 35%. Live out-of-sample signal logging commenced July 20, 2026.
Crisis Event Drawdown Analysis
Peak-to-trough drawdown during major historical shocks — net of 2 bps per-leg transaction costs
| Event | Date Range | Apex | 60/40 | S&P 500 |
|---|---|---|---|---|
| 2020 COVID Crash | Feb '20 – Mar '20 | -8.86% | -19.13% | -33.72% |
| 2022 Rate Shock | Jan '22 – Oct '22 | -9.72% | -20.69% | -24.50% |
| 2022 Full Bear Market | Jan '22 – Dec '22 | -11.36% | -20.69% | -24.50% |
| 2018 Q4 Selloff | Oct '18 – Dec '18 | -2.76% | -10.74% | -19.20% |
An American signal. Measured on your index, in your currency.
Every input to the Master Danger Index is a United States series, and nothing here pretends otherwise. The fair question from a desk outside the US is whether an American signal says anything about their market — so it was measured, against four criteria fixed in writing before the first run, and the index that failed is published alongside the three that passed.
Switzerland
The regime has ranked forward drawdown on the SMI since 2010.
- 71.4% of the SMI’s worst 1% of sessions fell inside a defensive regime, on 31.8% of sessions, across 22 independent stress episodes.
- In francs the same track drew down 30.11%, against 13.61% in dollars. Only 7.60 points of that was the strategy; the rest was the exchange rate. You are shown your own currency, not ours.
- The 2015 SNB floor removal and the March 2023 Credit Suisse weekend are both in the crisis replay.
European Union
The regime has ranked forward drawdown on the EURO STOXX 50 since 2010.
- 73.8% of the index’s worst 1% of sessions held on 31.7% of sessions, across 28 independent stress episodes — the most of any index measured.
- Evidence for the 10% depreciation notice under MiFID II Article 62, and for liquidity stress testing under ESMA34-39-897.
- MSCI World did not pass and is published as a failure: 17 independent episodes against the 20 required. Not demonstrated is not the same as does not work, and it is not being re-run for a better number.
United Kingdom
The regime identifies UK stress at least as well as it identifies American stress.
- 81.4% of the FTSE 100’s worst 1% of sessions fell inside a defensive regime — the highest tail capture in the study, higher than the S&P 500 control’s 76.2%.
- Its drawdown gradient is the shallowest measured, 1.42x against the control’s 1.99x. The value to a British book is in avoiding the worst sessions, not in cutting typical drawdown. Both halves are published.
- Sterling reporting, UK stamp duty stated on the trade ticket as a transaction cost, and the 2016 referendum and September 2022 gilt and LDI crisis in the crisis replay.
Whose obligation is whose. Oneiros Vision measures. It places no orders, holds no client money or assets, exercises no discretion and makes no recommendation. MiFID II, COBS, ESMA, SYSC and DORA bind your firm, not us. The platform produces evidence you may cite; it certifies nothing, and it is not registered, authorised or approved by any regulator.
Built for the demands of modern institutional capital.
Hedge Funds
Pipe the daily MDI score directly into your algorithmic execution engines via our secure REST API. When the API returns WARNING or CRITICAL, your internal algorithms automatically deleverage — halting buy-programs without human intervention.
Portfolio Managers
Daily T+1 trade tickets with configurable Implementation Speed. The Glide Execution Layer rotates your book toward the regime target at a pace your desk can actually execute — no more same-session 65% repositioning. AI-generated briefings add qualitative color to your quantitative risk data.
Family Offices & Wealth Funds
Protect multi-generational capital with illiquid private asset proxy mapping. The engine integrates Private Equity, Real Estate, and alternative holdings into the Master Regime framework via Illiquidity Beta scalars, ensuring your liquid portfolio hedges the structural risks embedded in opaque, immobile capital blocks.
RIAs
IPS/Mandate Compliance checking with real-time pass/breach validation. The Bayesian Conviction Score and Turnover Sensitivity Filter minimize unnecessary trades during weak, transitional regimes — protecting your clients from capital gains taxes and transaction friction.
Small Boutiques
Access a fully automated quantitative risk team. Run Monte Carlo drawdown simulations, replay your clients' portfolios through historical crises, and use the Scenario Sandbox for live client consultations — all without polluting your production analytics.
Mathematical precision to protect principal at all costs.
Uncompromising Capital Preservation
Engineered for Correlation 1.0 shocks where traditional 60/40 portfolios collapse simultaneously. In the Q4 2018 selloff, the engine absorbed only 14% of the S&P 500's drawdown — the clearest empirical proof of the mandate.
Regime & Risk-Allocation Overlay
The Master Danger Index (MDI) is an absolute 0–100 score synthesizing Speedometer (cross-asset volatility CDF), Sentiment (Weight-of-Evidence scoring of fear and positioning), and Macro Health (systemic liquidity & yield curve dynamics) into CALM, CHOP, WARNING, and CRITICAL regimes.
Advanced Stability & Ultra-Low Turnover
Four proprietary stability mechanisms — Vol-Cap Circuit Breaker, 5-Day Temporal Consensus Filter, Hysteresis Buffer, and Bayesian Regime Conviction Score — keep regime changes to about ten a year (10.2), with 67.8% of holding periods profitable net of 2 bps per-leg transaction costs.
The 'Intel Inside' API Gateway
Feed the MDI score, Regime State, Bayesian Conviction Score, and Turnover Sensitivity directly into your systematic execution engines via a secure, low-latency REST API — purpose-built for B2B WealthTech integration and algorithmic risk overlays.
Institutional Portfolio Analytics
Abandon error-maximizing Markowitz optimizers. Hierarchical Risk Parity (HRP) fed by Gerber Statistic co-movement matrices and Marchenko-Pastur eigenvalue denoising extracts true structural correlations, not the random noise that destroys traditional MVO in crash regimes.
The Glide Execution Layer
A configurable Implementation Speed caps the largest single-position move per session (e.g., 10% of the book). Tested across seven allocation mixes, a 10% cap keeps at least 98% of the drawdown benefit of trading the full rotation at the next close; a typical regime change then trades about a quarter of the book a day and completes in four sessions — at a pace a discretionary desk can actually execute.
The daily toolkit that wins mandates.
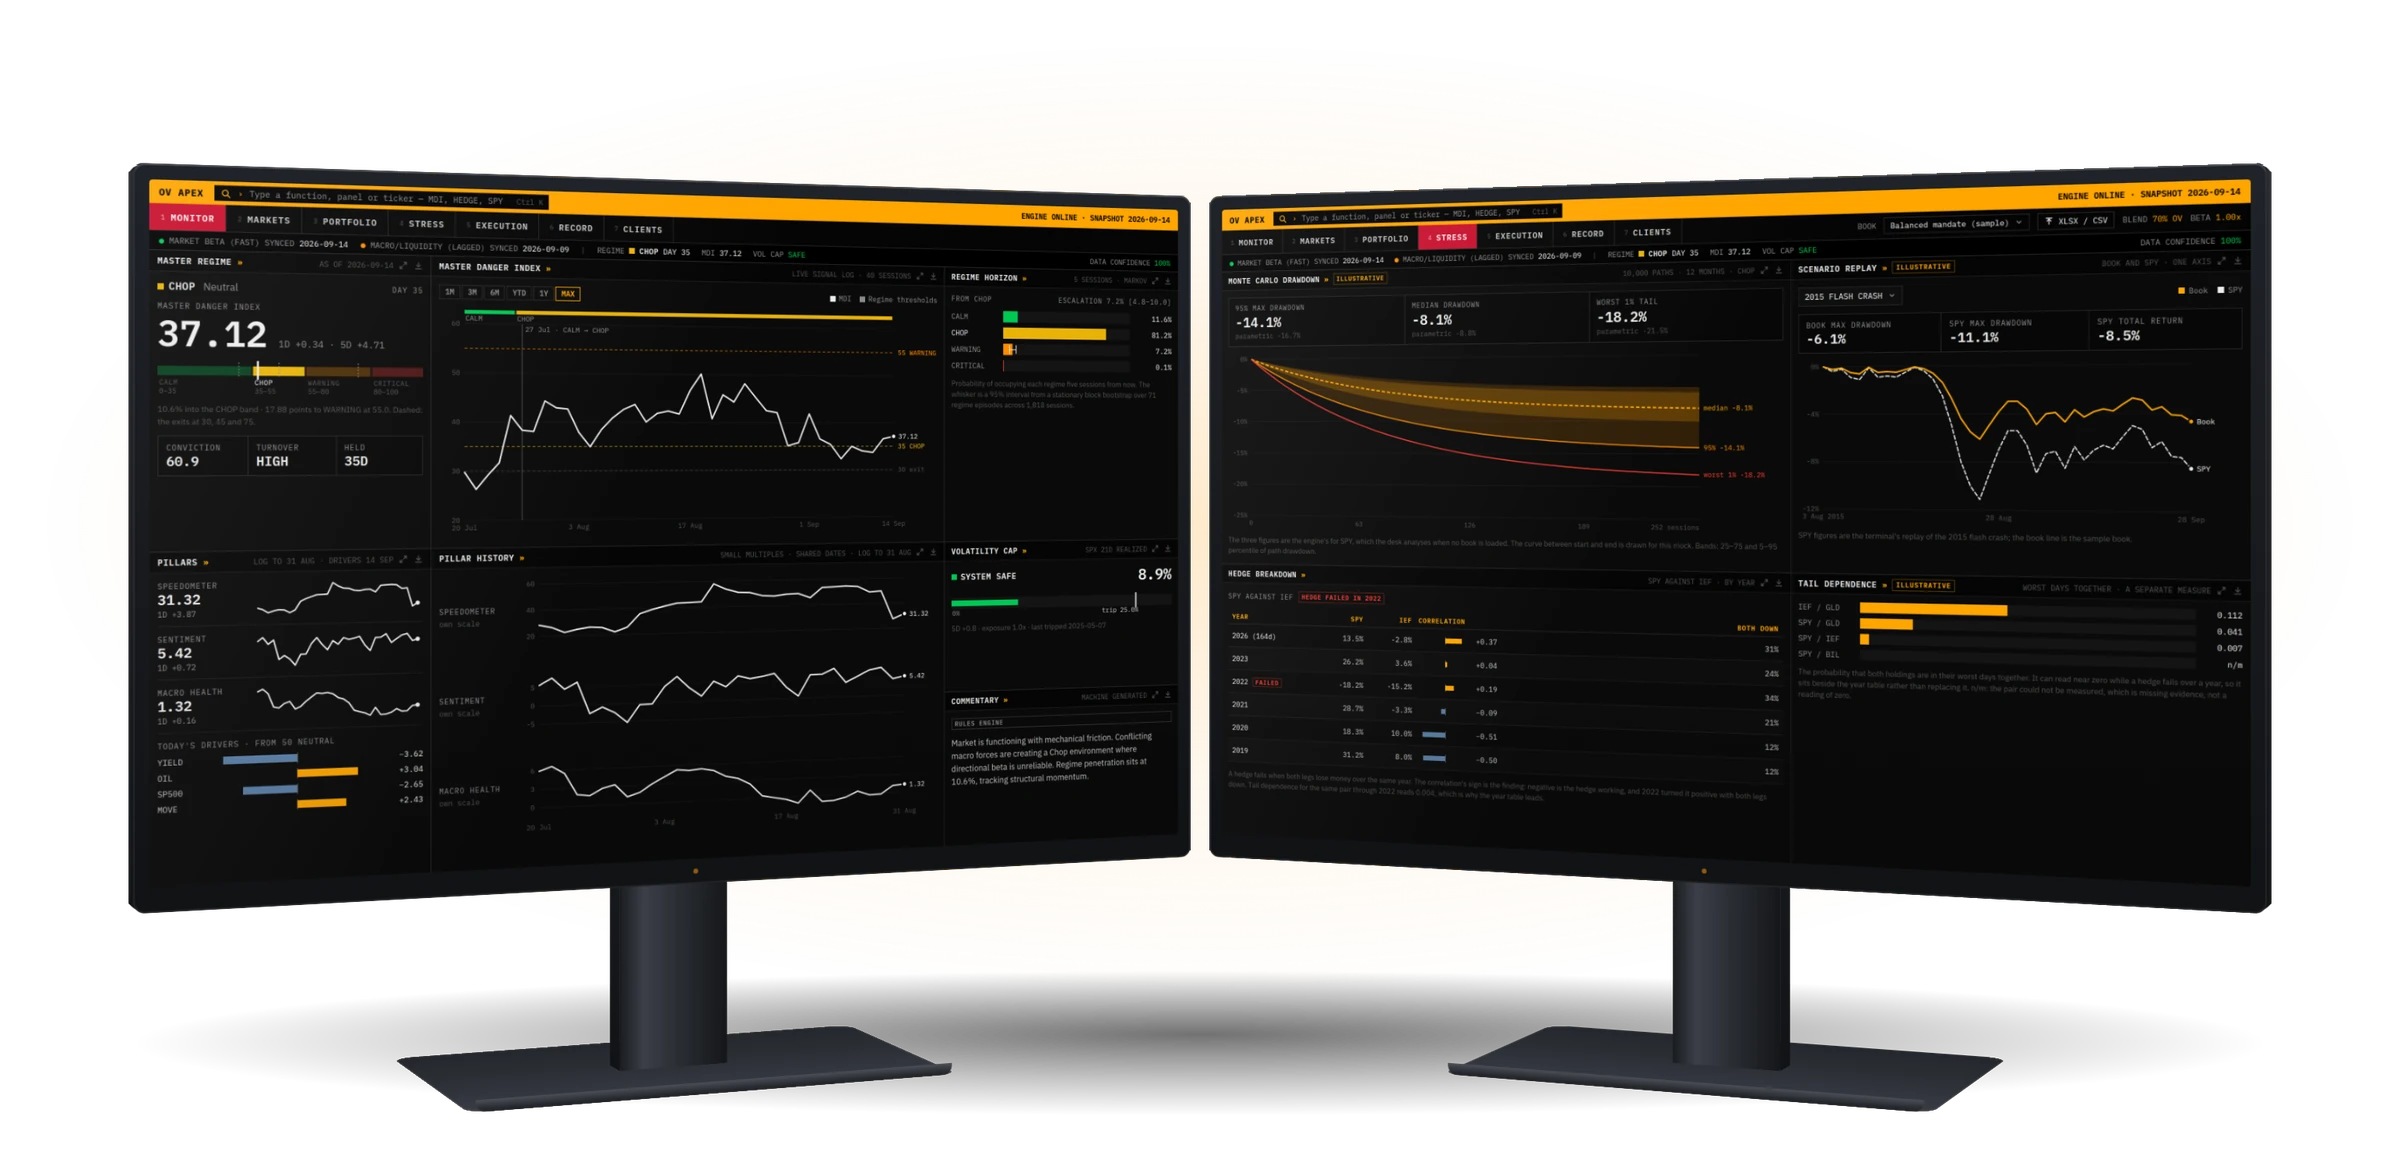
Beyond the MDI engine, the Risk Terminal equips Portfolio Managers with institutional-grade analytical tools for client communication, portfolio construction, compliance, and live consultation.
Markov Chain Horizon
5-Day Forward Probabilities
The empirical base rate of moving from the current regime to any other state over the next 5 sessions, counted from the live record rather than modelled. Reported with a 95% interval and the number of independent regime episodes behind it — because a rate drawn from a few dozen episodes is a range, not a point, and a terminal that hides that is asking to be trusted further than its evidence goes.
Monte Carlo Simulation
Probabilistic Loss Fan Chart
Paths are resampled from the portfolio's own return history rather than drawn from a normal distribution, so volatility clustering survives into the tail. Frame the downside as a frequency, never a cap: 19 of 20 simulated years stay inside X%, which means roughly one in twenty is worse. The parametric figure is reported beside it, so the distance between the two models is visible rather than assumed away.
Historical Scenario Replay
Crisis Time Machine
Back-calculate how the exact current portfolio would have performed during the 2015 Flash Crash, 2018 Q4 Sell-off, 2020 COVID Crash, and 2022 Rates & Tech Bear. Prove to skeptical prospects that the algorithmic hedges neutralized historical drawdowns.
Scenario Sandbox
What-If Isolation
Completely isolates session state from the PostgreSQL database, engaging a strictly local memory environment. Tweak Blend %, Beta multipliers, or simulate structural portfolio changes live with a client — with zero risk of polluting firm-wide analytics or triggering real execution orders.
IPS / Mandate Compliance
Real-Time Boundary Checker
Analyzes the proposed Target Blueprint against IPS limits (max equity, max concentration) using robust floating-point evaluation to prevent rounding-error false positives. Traffic light status: PASS or BREACH — protecting PMs from inadvertent mandate violations.
HRP + Gerber + MP Denoising
Institutional Optimization
Hierarchical Risk Parity replaces fragile Markowitz MVO. The Gerber Statistic measures co-movement via robust thresholds (not outliers), and Marchenko-Pastur Denoising scrubs random noise eigenvalues while preserving the true signal — creating crash-resilient allocations.
Expected Shortfall
Decomposed Per Holding
Value at Risk says how bad a bad day is. Expected Shortfall says how bad the days beyond it are — the measure Basel's FRTB put in VaR's place. Decomposed across holdings by Euler allocation, so each position carries its share of the tail loss, not just its share of the volatility. A position can be a fifth of the variance and half the loss.
Hedge Breakdown
When Diversification Stopped Working
A correlation describes an average day. This measures whether a hedge held in the years that mattered: both legs down, the sign of the relationship inverting, and the share of sessions where they fell together. Stocks and bonds correlated negatively every year from 2010 to 2020, then positively in 2022 — measured on the client's own book rather than asserted from a chart.
Signal Attribution
Why The Index Reads What It Reads
The Master Danger Index decomposes exactly into its seventeen inputs — an arithmetic identity, not a sampled approximation, so the contributions sum to the score to the ninth decimal. Every input is ranked and signed, and when a pillar reaches its bound the panel says so rather than reporting inputs that have stopped mattering.
Engineered for Resilience
The Oneiros Vision backend is built to withstand extreme market stress. Our architecture ensures that when Correlation 1.0 shocks hit, your risk analytics remain fast, accurate, and secure.
Isolated Tenant Architecture
Dedicated PostgreSQL instances for each institutional client, ensuring zero cross-tenant data contamination and maximum query performance during volatility.
MDI Regime Processing
The Master Danger Index synthesizes a Cumulative Distribution Function (CDF) of cross-asset volatility Z-scores, Weight-of-Evidence scoring of fear and positioning, and net systemic liquidity tracking into a single 0–100 structural risk score — entirely rules-based, fully auditable.
Enterprise Grade Security
End-to-end encryption at rest (AES-256) and in transit (TLS 1.3). SOC2 Type II compliant infrastructure with mandatory MFA and SSO integration.
B2B "Intel Inside" API Gateway
Package the MDI, Regime State, Bayesian Conviction Score, and Turnover Sensitivity into a secure REST API. Hedge funds, robo-advisors, and WealthTech platforms pipe our macro telemetry directly into their own execution systems — at a fraction of traditional enterprise data feed costs.
Ready to deploy the
OV Risk Terminal?
Access the industry-leading Master Danger Index and automated hedging blueprints. Built for institutional capital preservation.
Start your 14-day free trial today.